|

Economy
::Israel
Israel is considered one of the most advanced countries
in Southwest Asia in economic and industrial development.
In 2010, it joined the OECD.The country is ranked 3rd in
the region on the World Bank's Ease of Doing Business
Index as well as in the World Economic Forum's Global
Competitiveness Report. It has the second-largest number
of startup companies in the world (after the United
States) and the largest number of NASDAQ-listed companies
outside North America.
In 2009, Israel had the 49th-highest gross domestic
product and 29th-highest gross domestic product per capita
(at purchasing power parity) at $206.4 billion and
$28,393, respectively. The New Israeli Shekel is one of 17
freely convertible currencies according to the CLS list.
In 2010, Israel ranked 17th among of the world's most
economically developed nations, according to IMD's World
Competitiveness Yearbook. The Israeli economy was ranked
first as the world's most durable economy in the face of
crises, and was also ranked first in the rate of research
and development center investments.
The Bank of Israel was ranked first among central banks
for its efficient functioning, up from the 8th place in
2009. Israel was also ranked as the worldwide leader in
its supply of skilled manpower.
Despite limited natural resources, intensive
development of the agricultural and industrial sectors
over the past decades has made Israel largely
self-sufficient in food production, apart from grains and
beef. Other major imports to Israel, totaling $47.8 billion
in 2006, include fossil fuels, raw materials, and military
equipment Leading exports include fruits, vegetables,
pharmaceuticals, software, chemicals, military technology,
and diamonds; in 2006, Israeli exports reached $42.86
billion.
Israel is a global leader in water conservation and
geothermal energy, and its development of cutting-edge
technologies in software, communications and the life
sciences have evoked comparisons with Silicon Valley.
Intel and Microsoft built their first overseas research
and development centers in Israel, and other high-tech
multi-national corporations, such as IBM, Cisco Systems,
and Motorola, have opened facilities in the country. In
July 2007, U.S. billionaire Warren Buffett's Berkshire
Hathaway bought an Israeli company Iscar, its first non-U.S.
acquisition, for $4 billion. Since the 1970s, Israel has
received economic and military aid from the United States,
whose loans account for the bulk of Israel's external
debt.
Tourism
Main article: Tourism in Israel
Tourism, especially religious tourism, is an important
industry in Israel, with the country's temperate climate,
beaches, archaeological and historical sites, and unique
geography also drawing tourists. Israel's security
problems have taken their toll on the industry, but the
number of incoming tourists is on the rebound. In 2008,
over 3 million tourists visited Israel. Israel has the
highest number of museums per capita in the world.
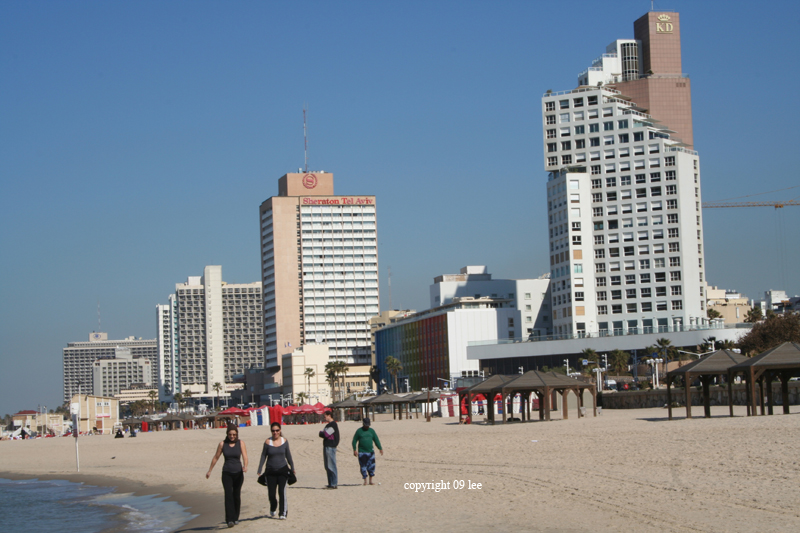
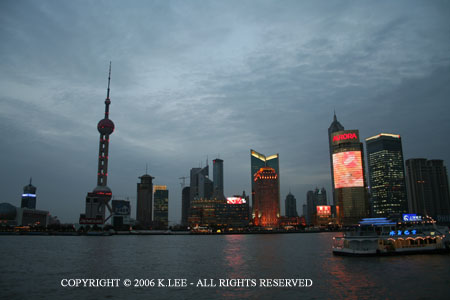
Tel Aviv Beach
|
Economy - overview:
|
Israel has a technologically advanced market
economy. It depends on imports of crude oil,
grains, raw materials, and military equipment.
Despite limited natural resources, Israel has
intensively developed its agricultural and
industrial sectors over the past 20 years. Cut
diamonds, high-technology equipment, and
agricultural products (fruits and vegetables)
are the leading exports. Israel usually posts
sizable trade deficits, which are covered by
large transfer payments from abroad and by
foreign loans. Roughly half of the government's
external debt is owed to the US, its major
source of economic and military aid. Israel's
GDP, after contracting slightly in 2001 and 2002
due to the Palestinian conflict and troubles in
the high-technology sector, grew about 5% per
year from 2004-07. The global financial crisis
of 2008-09 spurred a brief recession in Israel,
but the country entered the crisis with solid
fundamentals - following years of prudent fiscal
policy and a series of liberalizing reforms -
and a resilient banking sector, and the economy
has shown signs of an early recovery. Following
GDP growth of 4% in 2008, Israel's GDP grew by
0.5% in 2009 and is expected to expand in 2010.
The global economic downturn affected Israel's
economy primarily through reduced demand for
Israel's exports in the United States and EU,
Israel's top trading partners. Exports account
for about 45% of the country's GDP. The Israeli
Government responded to the recession by
implementing a modest fiscal stimulus package
and an aggressive expansionary monetary policy -
including cutting interest rates to record lows,
purchasing government bonds, and intervening in
the foreign currency market. The Bank of Israel
began raising interest rates in the summer of
2009 when inflation rose above the upper end of
the Bank's target and the economy began to show
signs of recovery.

Tel Aviv
|
|
|
GDP (purchasing power parity):
|
|
$206.9 billion (2009 est.)
country
comparison to the world: 51
$206.5 billion (2008 est.)
$197.8 billion (2007 est.)
note: data
are in 2009 US dollars
|
|
|
GDP (official exchange rate):
|
|
$195.4 billion (2009 est.)
|
|
|
GDP - real growth rate:
|
|
0.2% (2009 est.)
country
comparison to the world: 113
4.4% (2008 est.)
5.4% (2007 est.)
|
|
|
GDP - per capita (PPP):
|
|
$28,600 (2009 est.)
country
comparison to the world: 48
$29,000 (2008 est.)
$28,300 (2007 est.)
note: data
are in 2009 US dollars
|
|
|
GDP - composition by sector:
|
|
agriculture: 2.6%
industry: 32%
services: 65.4%
(2009 est.)
|
|
|
Labor force:
|
|
3.015 million (2009 est.)
country
comparison to the world: 103 |
|
|
Labor force - by occupation:
|
|
agriculture: 2%
industry: 16%
services: 82%
(September 2008)
|
|
|
Unemployment rate:
|
|
7.6% (2009 est.)
country
comparison to the world: 77
6.1% (2008 est.)
|
|
|
Population below poverty line:
|
|
23.6%
note: Israel's
poverty line is $7.30 per person per day (2007)
|
|
|
Household income or consumption by percentage
share:
|
|
lowest 10%: 2.5%
highest 10%: 24.3%
(2008)
|
|
|
Distribution of family income - Gini index:
|
|
39.2 (2008)
country
comparison to the world: 67
35.5 (2001)
|
|
|
Investment (gross fixed):
|
|
16.7% of GDP (2009 est.)
country
comparison to the world: 125 |
|
|
Budget:
|
|
revenues: $51.52
billion
expenditures: $61.51
billion (2009 est.)
|
|
|
Public debt:
|
|
77.7% of GDP (2009 est.)
country
comparison to the world: 17
75.2% of GDP (2008 est.)
|
|
|
Inflation rate (consumer prices):
|
|
3.3% (2009 est.)
country
comparison to the world: 113
4.6% (2008 est.)
|
|
|
Central bank discount rate:
|
|
1% (31 December 2009)
country
comparison to the world: 130
2.5% (31 December 2008)
|
|
|
Commercial bank prime lending rate:
|
|
3.73% (31 December 2009 est.)
country
comparison to the world: 138
6.06% (31 December 2008 est.)
|
|
|
Stock of narrow money:
|
|
$33.73 billion (31 December 2009)
$25.13 billion (31 December 2008)
|
|
|
Stock of broad money:
|
|
$208.8 billion (31 December 2009 est.)
$195.7 billion (31 December 2008 est.)
|
|
|
Stock of domestic credit:
|
|
$158.7 billion (31 December 2009)
country
comparison to the world: 41
$156.8 billion (31 December 2008)
|
|
|
Market value of publicly traded shares:
|
|
$188.7 billion (31 December 2009)
country
comparison to the world: 29
$134.5 billion (31 December 2008)
$236.4 billion (31 December 2007)
|
|
|
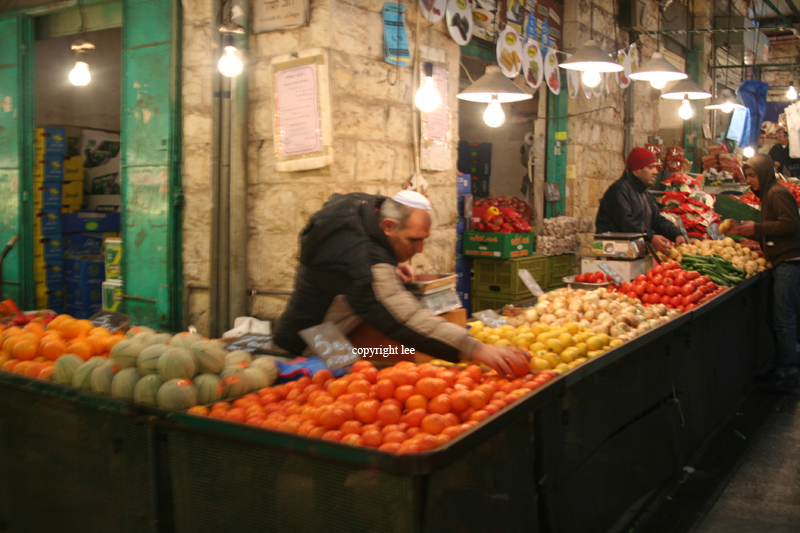
Agriculture - products:
|
|
citrus, vegetables, cotton; beef, poultry, dairy
products
|
|
|
Industries:
|
high-technology products (including aviation,
communications, computer-aided design and
manufactures, medical electronics, fiber
optics), wood and paper products, potash and
phosphates, food, beverages, and tobacco,
caustic soda, cement, construction, metals
products, chemical products, plastics, diamond
cutting, textiles, footwear
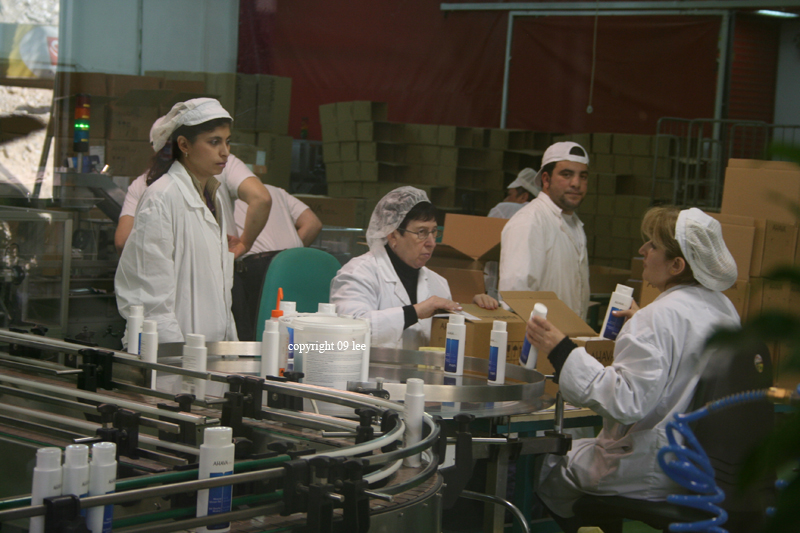
Dea Sea Factory
|
|
|
Industrial production growth rate:
|
|
-0.2% (2009 est.)
country
comparison to the world: 73 |
|
|
Electricity - production:
|
|
54.5 billion kWh (2008 est.)
country
comparison to the world: 46 |
|
|
Electricity - consumption:
|
|
46.38 billion kWh (2007 est.)
country
comparison to the world: 48 |
|
|
Electricity - exports:
|
|
2.081 billion kWh (2007)
|
|
|
Electricity - imports:
|
|
0 kWh (2008)
|
|
|
Oil - production:
|
|
3,806 bbl/day (2009 est.)
country
comparison to the world: 99 |
|
|
Oil - consumption:
|
|
231,000 bbl/day (2009 est.)
country
comparison to the world: 52 |
|
|
Oil - exports:
|
|
69,580 bbl/day (2007 est.)
country
comparison to the world: 74 |
|
|
Oil - imports:
|
|
318,900 bbl/day (2007 est.)
country
comparison to the world: 34 |
|
|
Oil - proved reserves:
|
|
1.94 million bbl (1 January 2010 est.)
country
comparison to the world: 95 |
|
|
Natural gas - production:
|
|
1.19 billion cu m (2008 est.)
country
comparison to the world: 62 |
|
|
Natural gas - consumption:
|
|
1.19 billion cu m (2008 est.)
country
comparison to the world: 88 |
|
|
Natural gas - exports:
|
|
0 cu m (2008 est.)
country
comparison to the world: 168 |
|
|
Natural gas - imports:
|
|
0 cu m (2008 est.)
country
comparison to the world: 160 |
|
|
Natural gas - proved reserves:
|
|
30.44 billion cu m (1 January 2010 est.)
country
comparison to the world: 70 |
|
|
Current account balance:
|
|
$7.637 billion (2009 est.)
country
comparison to the world: 27
$1.648 billion (2008 est.)
|
|
|
Exports:
|
|
$45.9 billion (2009 est.)
country
comparison to the world: 48
$57.16 billion (2008 est.)
|
|
|
Exports - commodities:
|
|
machinery and equipment, software, cut diamonds,
agricultural products, chemicals, textiles and
apparel
|
|
|
Exports - partners:
|
|
US 35.05%, Hong Kong 6.02%, Belgium 4.95% (2009)
|
|
|
Imports:
|
|
$45.99 billion (2009 est.)
country
comparison to the world: 47
$64.4 billion (2008 est.)
|
|
|
Imports - commodities:
|
|
raw materials, military equipment, investment
goods, rough diamonds, fuels, grain, consumer
goods
|
|
|
Imports - partners:
|
|
US 12.35%, China 7.43%, Germany 7.1%,
Switzerland 6.94%, Belgium 5.42%, Italy 4.49%,
UK 4.03%, Netherlands 3.98% (2009)
|
|
|
Reserves of foreign exchange and gold:
|
|
$60.61 billion (31 December 2009 est.)
country
comparison to the world: 27
$42.51 billion (31 December 2008 est.)
|
|
|
Debt - external:
|
|
$86.78 billion (31 December 2009 est.)
country
comparison to the world: 36
$86.08 billion (31 December 2008 est.)
|
|
|
Stock of direct foreign investment - at home:
|
|
$58.82 billion (31 December 2009 est.)
country
comparison to the world: 50
$56.93 billion (31 December 2008 est.)
|
|
|
Stock of direct foreign investment - abroad:
|
|
$55.02 billion (31 December 2009 est.)
country
comparison to the world: 28
$54.55 billion (31 December 2008 est.)
|
|
|
Exchange rates:
|
|
new Israeli shekels (ILS) per US dollar - 3.93
(2009), 3.588 (2008), 4.14 (2007), 4.4565
(2006), 4.4877 (2005)
|
|