|
Malaysia,
a middle-income country, has transformed itself
since the 1970s from a producer of raw materials
into an emerging multi-sector economy. Under
current Prime Minister NAJIB, Malaysia is
attempting to achieve high-income status by 2020
and to move farther up the value-added production
chain by attracting investments in Islamic
finance, high technology industries, medical
technology, and pharmaceuticals. The NAJIB
administration also is continuing efforts to boost
domestic demand and to wean the economy off of its
dependence on exports. Nevertheless, exports -
particularly of electronics - remain a significant
driver of the economy. As an oil and gas exporter,
Malaysia has profited from higher world energy
prices, although the rising cost of domestic
gasoline and diesel fuel, combined with strained
government finances, has forced Kuala Lumpur to
reduce government subsidies. The government is
also trying to lessen its dependence on state oil
producer Petronas, which supplies at least 40% of
government revenue. The central bank maintains
healthy foreign exchange reserves and its
well-developed regulatory regime has limited
Malaysia's exposure to riskier financial
instruments and the global financial crisis.
Nevertheless, decreasing worldwide demand for
consumer goods hurt Malaysia's exports and
economic growth in 2009, although both showed
signs of recovery in 2010. In order to attract
increased investment, NAJIB has also sought to
revise the special economic and social preferences
accorded to ethnic Malays under the New Economic
Policy of 1970, but he has encountered significant
opposition, especially from Malay nationalists.
|
|
|
GDP
(purchasing power parity):
|
|
$416.4
billion (2010 est.)
country
comparison to the world: 30
$388.8
billion (2009 est.)
$395.5
billion (2008 est.)
note:
data
are in 2010 US dollars
|
|
|
GDP
(official exchange rate):
|
|
$219
billion (2010 est.)
|
|
|
GDP
- real growth rate:
|
|
7.1%
(2010 est.)
country
comparison to the world: 18
-1.7%
(2009 est.)
4.7%
(2008 est.)
|
|
|
GDP
- per capita (PPP):
|
|
$14,700
(2010 est.)
country
comparison to the world: 77
$14,000
(2009 est.)
$14,500
(2008 est.)
note:
data
are in 2010 US dollars
|
|
|
GDP
- composition by sector:
|
|
agriculture:
9.1%
industry:
41.6%
services:
49.3%
(2010 est.)
|
|
|
Labor
force:
|
|
11.62
million (2010 est.)
country
comparison to the world: 45 |
|
|
Labor
force - by occupation:
|
|
agriculture:
13%
industry:
36%
services:
51%
(2005 est.)
|
|
|
Unemployment
rate:
|
|
3.5%
(2010 est.)
country
comparison to the world: 28
3.7%
(2009 est.)
|
|
|
Population
below poverty line:
|
|
5.1%
(2002 est.)
|
|
|
Household
income or consumption by percentage share:
|
|
lowest
10%: 2.6%
highest
10%: 28.5%
(2005 est.)
|
|
|
Distribution
of family income - Gini index:
|
|
46.1
(2002)
country
comparison to the world: 36
49.2
(1997)
|
|
|
Investment
(gross fixed):
|
|
20.1%
of GDP (2010 est.)
country
comparison to the world: 85 |
|
|
Public
debt:
|
|
52.6%
of GDP (2010 est.)
country
comparison to the world: 48
53.3%
of GDP (2009 est.)
|
|
|
Inflation
rate (consumer prices):
|
|
1.8%
(2010 est.)
country
comparison to the world: 50
0.6%
(2009 est.)
note:
approximately
30% of goods are price-controlled
|
|
|
Central
bank discount rate:
|
|
1% (31
December 2009)
NA%
(31 December 2008)
|
|
|
Commercial
bank prime lending rate:
|
|
5.08%
(31 December 2009 est.)
country
comparison to the world: 135
6.08%
(31 December 2008 est.)
|
|
|
Stock
of narrow money:
|
|
$69.03
billion (31 December 2010 est)
country
comparison to the world: 38
$57
billion (31 December 2009 est)
|
|
|
Stock
of broad money:
|
|
$337.6
billion (31 December 2010 est.)
country
comparison to the world: 25
$280.7
billion (31 December 2009 est.)
|
|
|
Stock
of domestic credit:
|
|
$314.7
billion (31 December 2010 est.)
country
comparison to the world: 33
$265.2
billion (31 December 2009 est.)
|
|
|
Market
value of publicly traded shares:
|
|
$256
billion (31 December 2009)
country
comparison to the world: 25
$187.1
billion (31 December 2008)
$325.7
billion (31 December 2007)
|
|
|
Agriculture
- products:
|
|
Peninsular
Malaysia - rubber, palm oil, cocoa, rice; Sabah -
subsistence crops, coconuts, rice; rubber, timber;
Sarawak - rubber, timber; pepper
|
|
|
Industries:
|
|
Peninsular
Malaysia - rubber and oil palm processing and
manufacturing, light manufacturing,
pharmaceuticals, medical technology, electronics,
tin mining and smelting, logging, timber
processing; Sabah - logging, petroleum production;
Sarawak - agriculture processing, petroleum
production and refining, logging
|
|
|
Industrial
production growth rate:
|
|
8.5%
(2010 est.)
country
comparison to the world: 22 |
|
|
Electricity
- production:
|
|
103.2
billion kWh (2007 est.)
country
comparison to the world: 32 |
|
|
Electricity
- consumption:
|
|
99.25
billion kWh (2007 est.)
country
comparison to the world: 30 |
|
|
Electricity
- exports:
|
|
2.268
billion kWh (2007 est.)
|
|
|
Electricity
- imports:
|
|
0 kWh
(2008 est.)
|
|
|
Oil
- production:
|
|
693,700
bbl/day (2009 est.)
country
comparison to the world: 27 |
|
|
Oil
- consumption:
|
|
536,000
bbl/day (2009 est.)
country
comparison to the world: 31 |
|
|
Oil
- exports:
|
|
511,900
bbl/day (2007 est.)
country
comparison to the world: 30 |
|
|
Oil
- imports:
|
|
314,600
bbl/day (2007 est.)
country
comparison to the world: 35 |
|
|
Oil
- proved reserves:
|
|
2.9
billion bbl (1 January 2010 est.)
country
comparison to the world: 32 |
|
|
Natural
gas - production:
|
|
57.3
billion cu m (2008 est.)
country
comparison to the world: 17 |
|
|
Natural
gas - consumption:
|
|
26.27
billion cu m (2008 est.)
country
comparison to the world: 30 |
|
|
Natural
gas - exports:
|
|
31.03
billion cu m (2008 est.)
country
comparison to the world: 8 |
|
|
Natural
gas - imports:
|
|
0 cu m
(2008 est.)
country
comparison to the world: 98 |
|
|
Natural
gas - proved reserves:
|
|
2.35
trillion cu m (1 January 2010 est.)
country
comparison to the world: 16 |
|
|
Current
account balance:
|
|
$34.83
billion (2010 est.)
country
comparison to the world: 13
$34.08
billion (2009 est.)
|
|
|
Exports:
|
|
$192.8
billion (2010 est.)
country
comparison to the world: 25
$157.5
billion (2009 est.)
|
|
|
Exports
- commodities:
|
|
electronic
equipment, petroleum and liquefied natural gas,
wood and wood products, palm oil, rubber,
textiles, chemicals
|
|
|
Exports
- partners:
|
|
Singapore
13.9%, China 12.2%, US 10.9%, Japan 9.8%, Thailand
5.4%, Hong Kong 5.2% (2009)
|
|
|
Imports:
|
|
$149.2
billion (2010 est.)
country
comparison to the world: 29
$117.3
billion (2009 est.)
|
|
|
Imports
- commodities:
|
|
electronics,
machinery, petroleum products, plastics, vehicles,
iron and steel products, chemicals
|
|
|
Imports
- partners:
|
|
China
13.9%, Japan 12.5%, US 11.2%, Singapore 11.1%,
Thailand 6%, Indonesia 5.3% (2009)
|
|
|
Reserves
of foreign exchange and gold:
|
|
$104.1
billion (31 December 2010 est.)
country
comparison to the world: 14
$96.71
billion (31 December 2009 est.)
|
|
|
Debt
- external:
|
|
$62.82
billion (31 December 2010 est.)
country
comparison to the world: 47
$58.79
billion (31 December 2009 est.)
|
|
|
Stock
of direct foreign investment - at home:
|
|
$77.44
billion (31 December 2010 est.)
country
comparison to the world: 43
$74.64
billion (31 December 2009 est.)
|
|
|
Stock
of direct foreign investment - abroad:
|
|
$82.65
billion (31 December 2010 est.)
country
comparison to the world: 27
$75.62
billion (31 December 2009 est.)
|
|
|
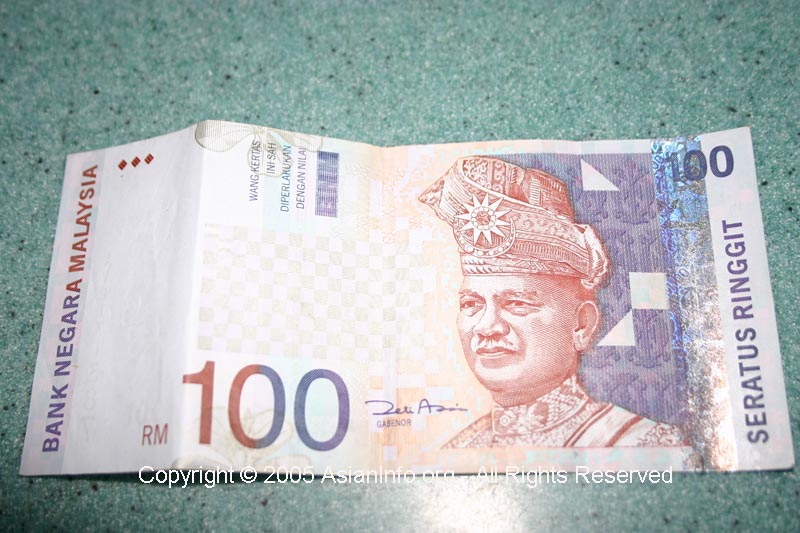
Exchange
rates:
|
|
ringgits
(MYR) per US dollar - 3.2182 (2010), 3.5246
(2009), 3.33 (2008), 3.46 (2007), 3.6683 (2006)
|
|
|
|